Guide to monitor the performance of running Windows 10 continuously using a floating window. Windows 10 has windows that show the performance of computer usage, including CPU, GPU, memory drive, network performance … Users can always pin this window at the top. Have you ever wanted to monitor your computer’s resource usage in real time? Windows 10 has a window to display computer performance, including CPU, GPU, memory drive, network performance … Also, you can pin this window at the top while using the device. The window is accessed via Task Manager. If necessary, please refer to the specific instructions below.
How to Pin Performance Window in Windows 10
To open the Task Manager in Windows 10, press Ctrl + Shift + Esc, or right-click the Taskbar below and select Task Manager.
To keep this window floating above other windows, click Options => Always on Top.
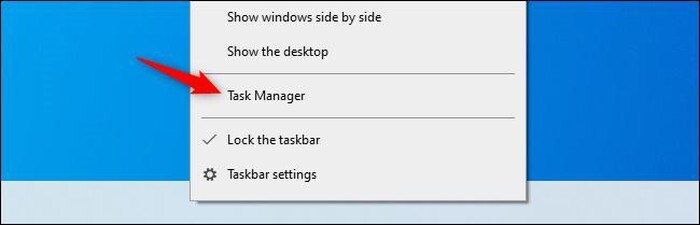
To open the Task Manager in Windows 10, press Ctrl + Shift + Esc, or right-click the Taskbar below and select Task Manager.
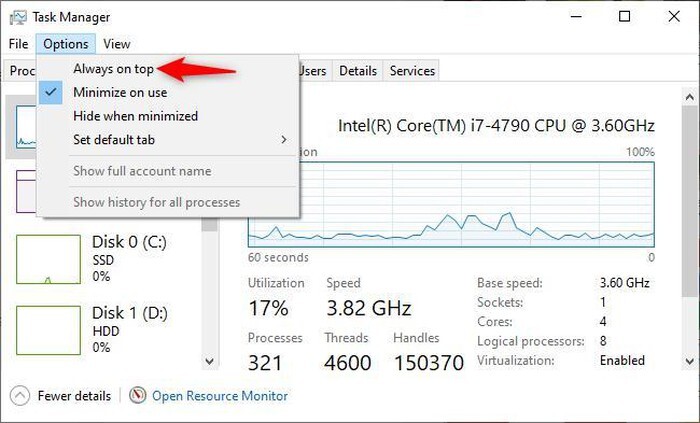
To keep this window floating above other windows, click Options => Always on Top.
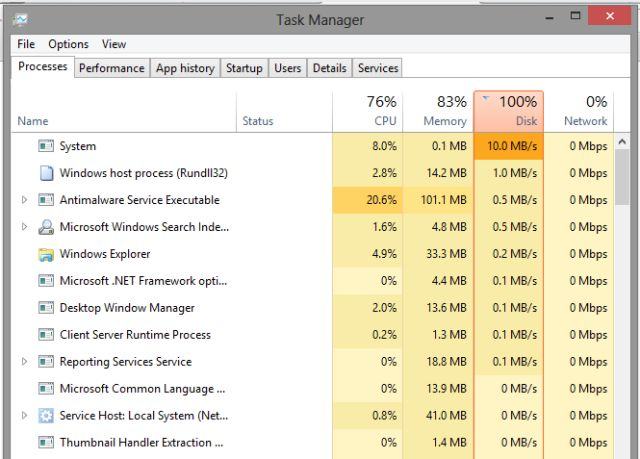
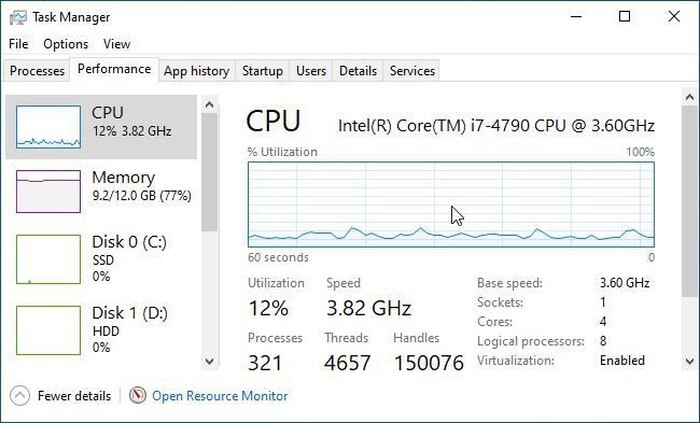
Then click the Performance tab. If you don’t see this tab, click “More Details” at the bottom.
Then click the Performance tab.
Now you can select the performance chart you want to see in the left bar. You will see options for the computer’s CPU, memory, storage drive (including SSDs, hard drives and USB devices), network connections (Ethernet and Wi-Fi), GPU …
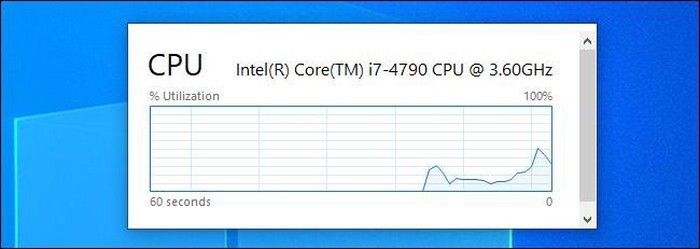
To show only the performance graph, double-click anywhere on the chart. You can also right-click on the chart and select “Graph Summary View”.
To show only the performance graph, double-click anywhere on the chart. You can also right-click on the chart and select “Graph Summary View”.
You can resize this window, and you can also click and drag inside the window to move it wherever you want on the screen.
To re-zoom the Task Manager window, simply double-click inside the chart, or right-click and uncheck “Graph Summary View”. You can then switch to another graph, for example from CPU to GPU.
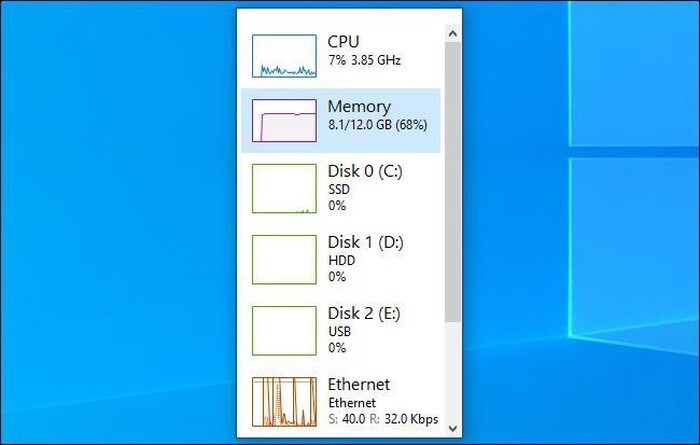
You can also pin the left-hand menu by double-clicking anywhere in the left pane. It’s a great way to keep track of multiple resource stats at the same time.
You can also pin the left-hand menu by double-clicking anywhere in the left pane. It’s a great way to keep track of multiple resource stats at the same time.