Logarithmic graph vs. Linear graph and how does it help explain the spread of COVID-19?The most common form of a line-graph has a linear scale. Along the Y axis, the numbers progress in a steady, linear form – 1, 2, 3, 4, or 10, 20, 30 and so on.

Interpreting information
The most common form of a line-graph has a linear scale. Along the Y axis, the numbers progress in a steady, linear form – 1, 2, 3, 4, or 10, 20, 30 and so on.
On a logarithmic scale, numbers on the Y-axis don’t move up in equal increments but instead each interval increases by a set factor – it’s often 10 but could be a factor of 3 or 350 or 3,500, anything at all. It all depends on what is deemed to be the most effective way of interpreting the data in question. The Richter scale is logarithmic – an earthquake that measures 6 is 10- times more destructive than one that measures 5.
The logarithmic scale is ideal for measuring rates of change, particularly rates of growth, explains mathematician, teacher, and author of The Life-Changing Magic of Numbers, Bobby Seagull.
It “flattens out the rate of growth so it becomes easier to see,”, he says. “On a logarithmic graph of COVID-19 infections, even though the overall numbers are still increasing, you can see the point at which the rate of growth starts to level off when that exponential growth has stopped.”
At that point, the logarithmic scale makes it possible to see when public health measures are starting to have the desired effect.
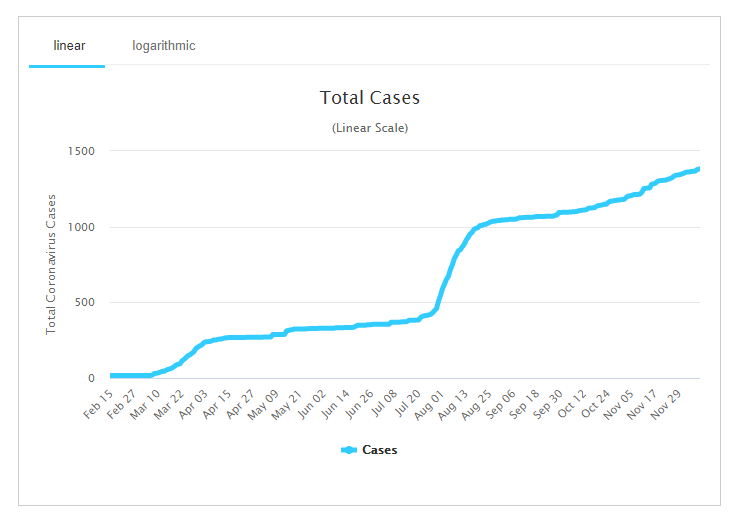
This is what the COVID-19 situation in Vietnam looks like when plotted on a linear graph.
Total Coronavirus Cases in Vietnam
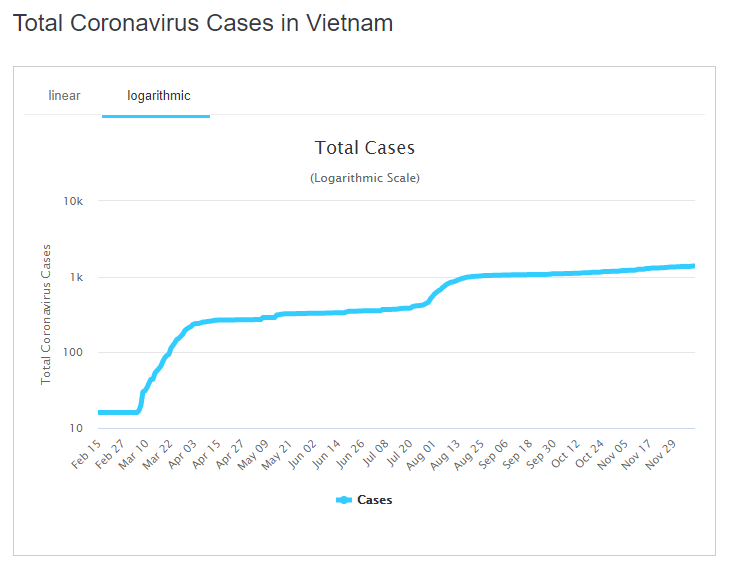
A logarithmic graph can also help make it clear if the apparent evening-out of the curve started to change. While a linear curve would keep on pushing ever higher regardless, the logarithmic graph would highlight any substantial changes to the trend – whether upward or downward.
It’s an approach that is often preferred when there are huge numbers involved and a linear scale would just produce a dramatic-looking exponential curve.